Structure of Our Publishing Costs
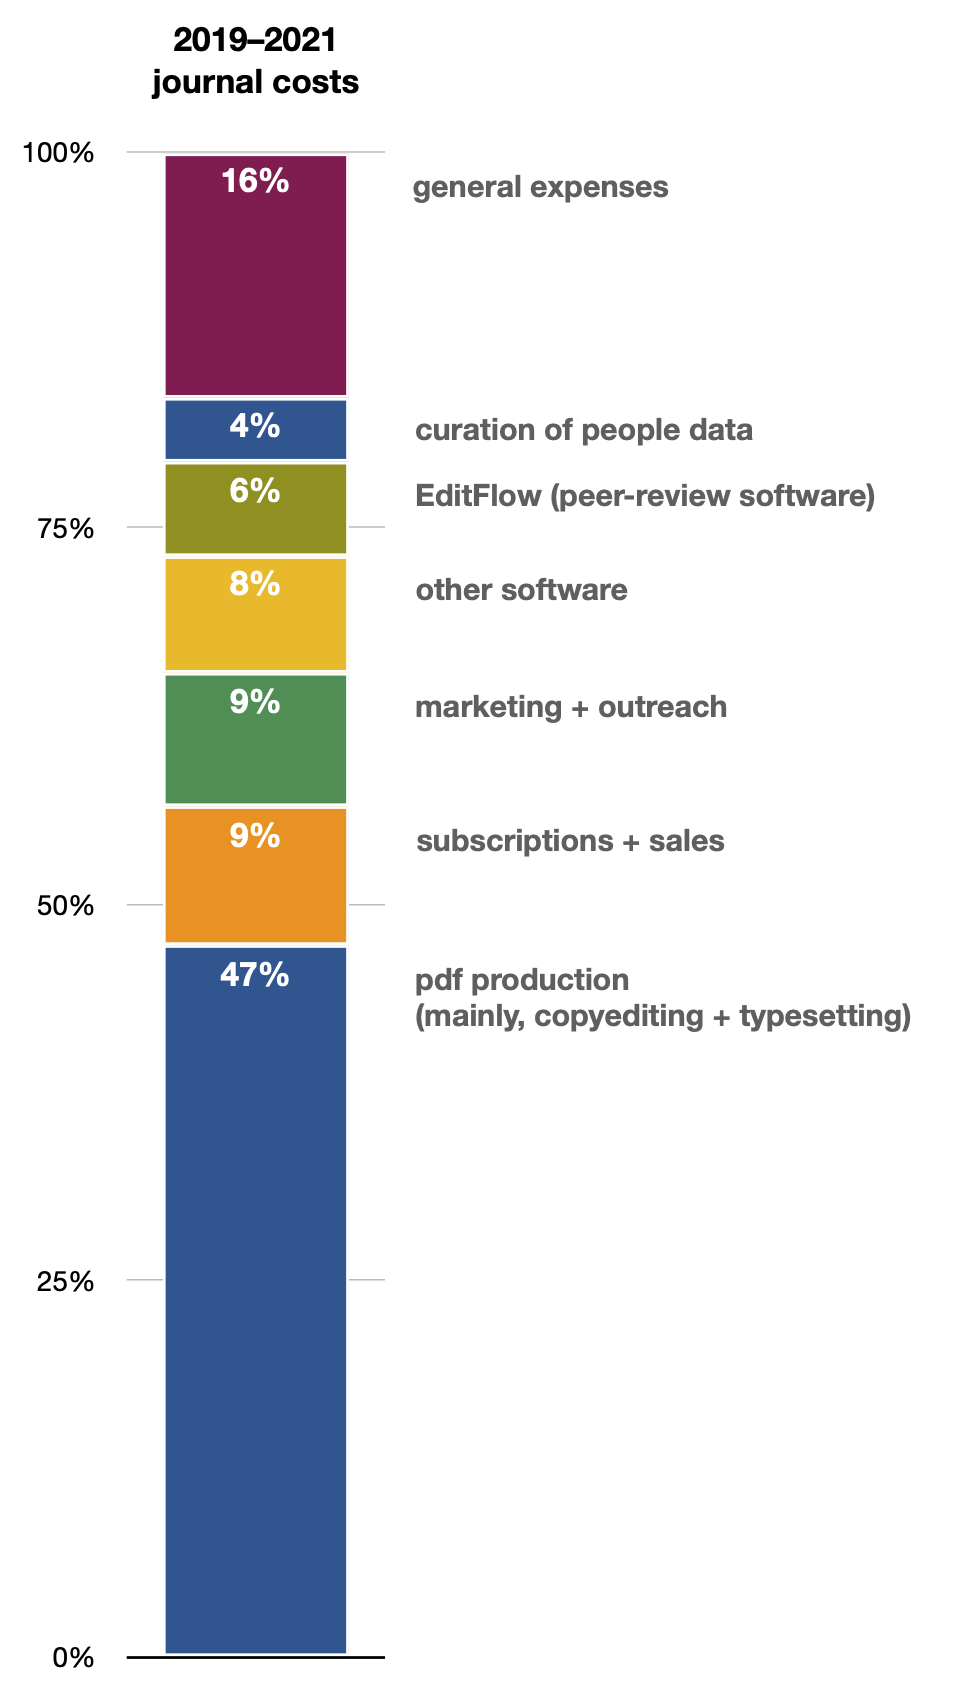
Stacked bar graph for the breakdown of electronic journal publishing costs, 2019-2021, showing: 16% general expenses; 4% curation of people data; 6% EditFlow (peer-review software); 8% other software; 9% marketing + outreach; 9% subscriptions + sales; 47% pdf production (mainly, copyediting + typesetting).

This is the break­down of the share of costs al­loc­ated to the elec­tron­ic pub­lic­a­tion of our journ­als, com­puted from the peri­od 2019–2021:

  • 4% cur­a­tion of people data;
  • 6% Ed­it­Flow (peer-re­view soft­ware);
  • 8% oth­er soft­ware;
  • 9% mar­ket­ing + out­reach;
  • 9% sub­scrip­tions + sales;
  • 47% PDF pro­duc­tion (mainly, copy­ed­it­ing + type­set­ting);
and fi­nally,
  • 16% gen­er­al ex­penses.
Print­ing and ship­ping of phys­ic­al journ­al is­sues are offered as an op­tion­al ex­tra ser­vice, and are not ac­coun­ted here.